Social Media Engagement Rate Calculator
Enter followers, average likes and average comments to get an engagement rate instantly. Follower-based and view-based formulas, honest rule-of-thumb benchmarks, and no signup.
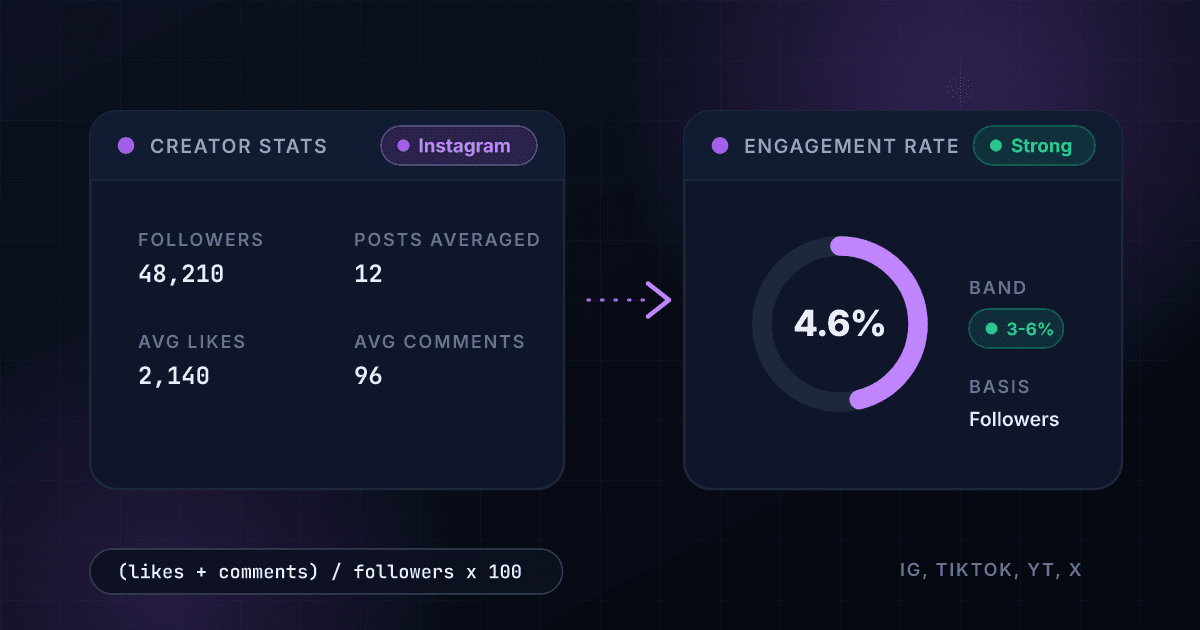
Engagement rate = (likes + comments) ÷ followers × 100, averaged over recent posts. On TikTok and YouTube, divide by views instead of followers. As a rule of thumb, a follower-based rate under 1% is low, 1-3% is typical, 3-6% is strong, and above 6% is exceptional. View-based rates read higher.
Which platform?
Follower-based is the standard measure on Instagram.
Use averages from the account's last 10 to 12 posts, excluding giveaways and viral outliers.
(500 likes + 25 comments) ÷ 25,000 followers × 100 = 2.10%. By the common rule of thumb, that is a typical follower-based engagement rate.
Engagement rate
2.10%
TypicalRule-of-thumb bands (follower-based)
Low
under 1%
Typical
1% to 3%
Strong
3% to 6%
Exceptional
above 6%
Formula: (average likes + average comments) ÷ followers × 100. The bands are widely used rules of thumb, not standards: typical rates vary by platform, content format and audience size, and bigger accounts usually trend lower. Everything runs in your browser and nothing is uploaded.
The two engagement rate formulas
(likes + comments) ÷ followers × 100
Follower-based
Measures how much of the claimed audience actually responds. The standard on Instagram and X, and the right measure when you are auditing whether an audience is real, because it punishes accounts padded with inactive or bought followers.
(likes + comments) ÷ views × 100
View-based
Measures how content performs with the people who actually saw it. The standard on TikTok and YouTube, where recommendation feeds put posts in front of many non-followers, so follower count says little about reach.
Both are averaged over recent posts, and both are valid. The one mistake to avoid is mixing them: view-based numbers read higher than follower-based ones, so comparing a creator's view-based rate against another's follower-based rate will always mislead you. Pick one formula per comparison and apply it to every account.
Why engagement rate beats follower count
Follower count is a stock: everything an account has ever accumulated, including people who followed years ago and left, bots, and giveaway entrants. Engagement rate is a flow: how many people respond to the account right now. When you are deciding whether to sponsor a creator, the flow is what you are buying.
That is also why the rate is hard to game cleanly. Buying followers makes the denominator bigger and the rate worse. Buying engagement is possible, but it tends to leave patterns that show up under inspection: generic comments, bursts of activity, and rates far outside the norm for the account's size. A small account with a genuinely high rate often delivers more real attention per dollar than a large account with a low one.
How to measure it honestly
- Average 10 to 12 recent posts. One post is noise. A recent-post average is the standard way to get a number that reflects the account today rather than one lucky upload.
- Exclude giveaways and contests. Posts that pay people to engage measure the prize, not the audience. Leave them out of the average.
- Exclude viral outliers. A post that reached far beyond the normal audience drags the average away from what a sponsor would actually get. Note it separately if it matters.
- Use one formula per comparison. Follower-based or view-based, applied identically to every account, on the same platform, over the same number of posts.
- Recompute before you commit. Rates drift. A rate computed from a months-old screenshot can be badly stale by the time a deal is signed, so pull fresh numbers.
Why rates differ by platform and account size
Platforms distribute content differently. TikTok and YouTube push posts through recommendation feeds, so views come heavily from non-followers and view-based rates are the honest measure. Instagram and X lean more on follower relationships, so follower-based rates carry more meaning there. The cost of an interaction differs too: a quick tap of a like is cheaper for the viewer than writing a comment, so like-heavy platforms read higher on raw engagement.
Account size matters as well. Bigger accounts trend toward lower follower-based rates: as an audience grows it gets broader and less personally connected, and the follower count accumulates more inactive people over time. That is a widely observed qualitative pattern, not a law, and it is the reason the fair comparison for any account is other accounts of similar size on the same platform.
Engagement rate FAQ
How do you calculate engagement rate?
The standard formula is (likes + comments) divided by followers, multiplied by 100, averaged over your last 10 to 12 posts. Add shares and saves if the platform reports them to you. On TikTok and YouTube, where the feed shows content to non-followers, the common alternative is (likes + comments) divided by views, multiplied by 100. Whichever formula you pick, apply it identically to every account you compare.
What is a good engagement rate?
As a rule of thumb for follower-based rates: under 1% is low, 1% to 3% is typical, 3% to 6% is strong, and above 6% is exceptional. These bands are conventions, not standards. Typical rates differ by platform, content format and audience size, and bigger accounts usually trend lower, so compare an account against similar accounts on the same platform rather than against one universal number.
What is the difference between follower-based and view-based engagement rate?
Follower-based rate divides engagement by follower count and measures how much of a claimed audience actually responds. View-based rate divides engagement by views and measures how well content performs with the people who actually saw it. Follower-based suits Instagram and X. View-based suits TikTok and YouTube, where recommendations put content in front of many non-followers. View-based numbers read higher, so never mix the two in one comparison.
Why is my engagement rate falling?
Common causes: a follower count that grew faster than the audience's real interest, a run of weaker content, posting more or less often than usual, a format shift on the platform, or engagement that was inflated earlier and has decayed. Recompute the rate over your last 10 to 12 posts, exclude giveaways and viral outliers, and compare against the same measure from earlier months to find when the drop started.
How do brands use engagement rate?
Brands use engagement rate to vet creators before paying for sponsorships, because follower count alone is easy to inflate and says nothing about attention. A small account with a high rate often outperforms a large account with a low one. Most brands compute the rate from recent posts, compare it against accounts of similar size on the same platform, and treat unusually high or uniform numbers as a flag to investigate.
Can engagement rate be faked?
Yes. Engagement pods, bought likes and bot comments all inflate the numbers, which is exactly why brands check the rate instead of trusting it blindly. Warning signs include generic repeated comments, engagement that arrives in unnatural bursts, and rates far above the norm for the account's size. Pulling live follower and engagement data by API, rather than relying on screenshots, catches some of this.
Vetting creators at scale?
Manual math works for one account. For a list of candidates, pull live follower counts, engagement and post metrics straight from 1Lookup's APIs instead of copying numbers from screenshots.